Shield UI Charts alternatives
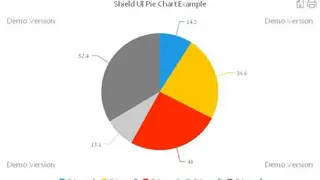
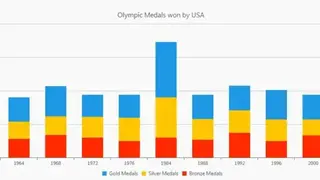
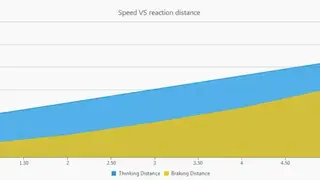
Shield UI Charts is a JavaScript Chart tool that allows you to render various charts, time series, gauges, and maps for your web and mobile applications in minutes. Thanks to its modular architecture, the charts can be easily extended with new chart types by using its SDKs. The software offers Line Chart, Area Charts Bar Chart, Polar Area Chart, Bubble Chart, Stream Graph, Radar Chart, Candlestick Chart, Bar Chart, Doughnut Chart, Pie Chart, Step Area Chart, Step Line Chart, etc. It has been designed with accessibility and performance in mind.
Shield UI Charts are accessible across all modern browsers and mobile devices, including those that support touch gestures. Shield UI Charts was built to provide comprehensive and flexible solutions for today’s enterprise-level applications. The framework works with any ES2015+ capable JavaScript environment like Node.js, React, Angular 2+, etc. The components in Shield UI Charts are built using open web standards, which lets you use them in any JavaScript environment and enjoy maximum compatibility with other popular UI libraries.