VisualVM alternatives
VisualVM is a visual integrating tool that includes several command-line JDK and lightweight-profiling as well. The tool can troubleshoot and monitor the applications that are running on Java 1.4 or higher form various vendors with the help of multiple technologies such as serviceability agents, attach API, and JVM stats. It is compatible with the web-based platforms and the source of VisualVM available on the GitHub.
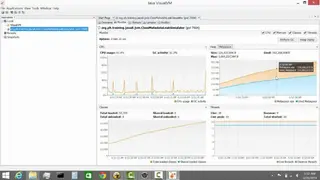
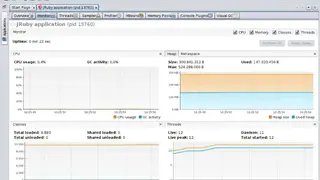
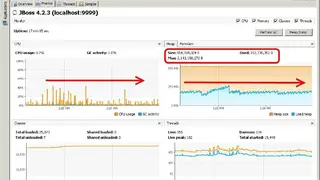
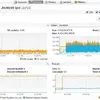
It can detect the remotely running Java applications and locally lists automatically and define the applications by JMX connections manually. The solution provides an easy and straightforward interface to monitors the application permanent generation memory, CPU usage & GC activity, met space and heap as well.
It has a timeline features that display all threads running in the process of java with monitoring time, aggregated running, sleeping, and wait for procedures. One of the core features of VisualVM includes profile performance and memory usage that holds the profiling capabilities to analyze the memory management and execution of applications.
The solution can display thread dumps that is going in the process of targeting and help you to find distributed deadlocks efficiently. It allows you to create and view the memory snapshots such as .hprof, which handles debugging memory leaks and inefficient heap usage. It offers multiple plugins for an application like experimental and third party plugin with security.