Home Development Online Services

ZingChart alternatives
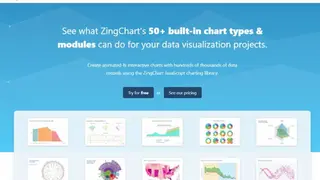
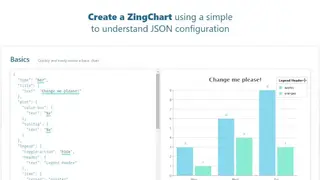
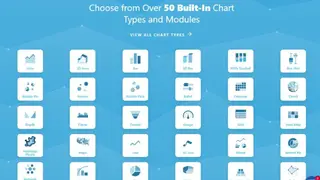
ZingChart is a popular platform that offers more than 50 built-in modules and chart types that you can use inside the data visualization projects. Everyone can use the rich library of tools to create interactive and animated charts composed of dozens of data records. You can easily create a ZingChart by making use of a simple JSON configuration. There are over 50 charts that you can select from like Box Plot, Area, 100% Stacked, 3D Area, 3D Bar, Bar, Bubble pie, Chord, Bullet, Calendar, Nested Pie, Maps, Range, Violin, Radar, and Grid.
The platform provides Crosshairs, Value Boxes, and Tooltips that allow the individual to find the correct value quickly. These come in handy when the dataset is minimal and actual values are necessary. You can show values without needing tooltips. This comes in handy when big datasets are present, making value boxes on nodes become cluttered. You can enable more granularity with Crosshairs, which simplifies the inspection of the spectrum of values. Other features include Zooming on several axes, getting an overview of data while zoomed with preview, and the ability to modify plot visibility with Toggle.