Google Chart Tools alternatives
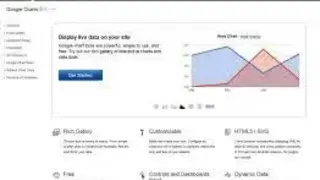
Google Chart Tools is the world’s most popular tool that allows users to display their data on their website via attractive or straightforward visualizations. The tool is widely used with the simple JavaScript embedded on the web page. With this tool, users can easily create simple line charts or create a complex hierarchical mas with ease.
The best part is that you can get to do this for free, regardless of the institution or business you are representing or if you are applying the system for personal purposes. Aside from the default Google theme, users are also treated to a massive wide range of customization options for their charts.
It is quite simple and easy to use. Users only have to embed the application, load the Google Chart libraries, and enter data to be charted. After a few customization and assignment of an ID, the chart can then be activated on the web page. The tool can be injected with interactive elements such as events and animation.
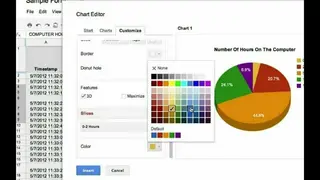
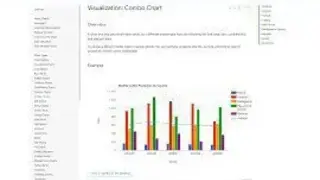
Users have total control over how they want to display their data via the dashboards. Chart data can also be configured based on roles, dates, and time. Unlike all the other similar platforms, it also contains all the primary services with some advanced features such as chart galleries, timelines, trend lines, format and chart editors, etc.