Google Charts alternatives
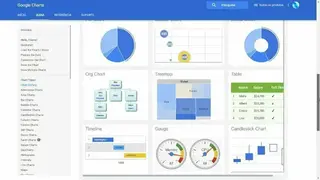
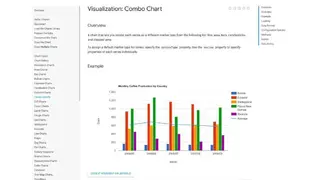
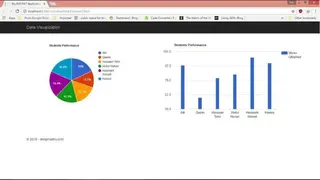
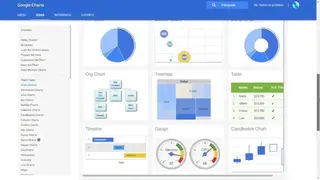
Google Charts is an online tool that enables users to display their data on their website via attractive or straightforward visualizations. It is widely used with simple JavaScript embedded on the web page. With this tool, users can easily create simple line charts or build a complex hierarchical map.
The best part about this Google tool is that you can get to do this for free, regardless of institution or business you are representing. Aside from default Google them, users can treat a wide range of customization options for their charts.
This tool is quite easy to use as users only have to embed the tool, load the Google Chart libraries, and enter the data into the chart. After customization and assigning an ID, the chart can activate on the web page.
There is also a large community is there to answer whatever question you may have. Google Charts can insert interactive elements, including Events and Animations. Users have total control over how they display their data via its dashboard.