Home Office & Productivity Tool

KPI Dashboard in Excel alternatives
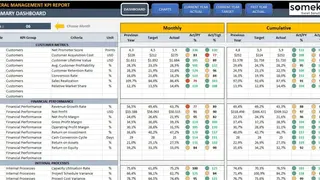
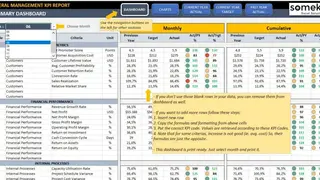
Key Performance Indicators (KPI) Dashboard in Excel comes bundled with multiple features like monthly and cumulative analysis, trend charts, and past/target comparisons to help businesses worldwide track their metrics and assess their success at achieving goals. KPI Dashboard displays the core improvement areas of a company and is done successfully if general management follows the recommendations given by the dashboard. This is the sole reason for choosing the suitable KPIs that meets the need of your organization.
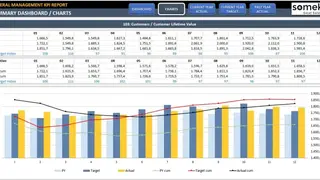
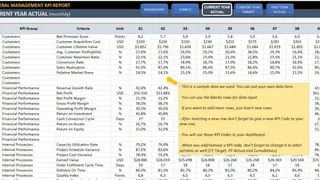
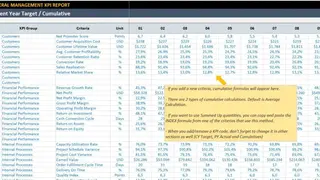
An ideal KPI Dashboard should have actionable and comprehendible Key Performance Indicators that will concentrate on the firm’s better performance. KPI Dashboard in Excel provides many advanced features including White Label, Comparing Past and Target values side by side, Detailed on-sheet instructions, fully functional with Excel 2007 and above versions, does not have any VBA macros, beautiful designs that you can use in presentations, Dashboard showing summary with interactive charts, and more.