Home Office & Productivity Tool

Zebra BI for Excel alternatives
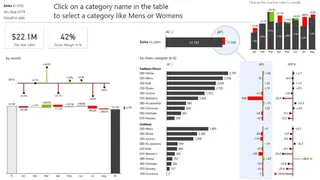
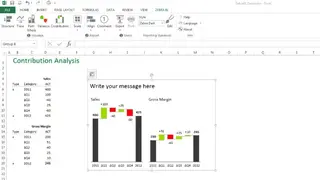
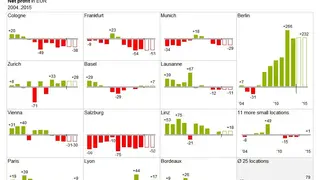
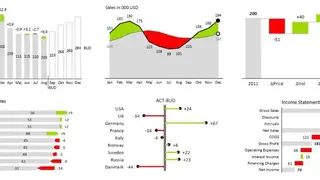
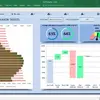
Zebra BI offers an advanced Chart add-in for Microsoft Excel that allows you to explain complex topics easily. It includes charts not found in Excel, such as Variance charts, Lollipops, Waterfalls, Hills and Valleys, and more to help you create insightful business presentations. You can create charts by clicking anywhere in the data table and choosing a business chart or by using formulas and values, PowerPivot, and Pivot tables. The charts are dynamic and update automatically. All you need to do is replace old values with new ones, refresh them, and the changes will show up.
It provides Snap move, which allows everyone to integrate charts into tables without much effort. This functionality lets you build combined table-chart reports in half the time. View differences, write comments, and Highlight categories to create the best possible visualization. Zebra BI for Excel allows you to perform comparisons more easily through the Scale feature, which can scale the desired number of charts.